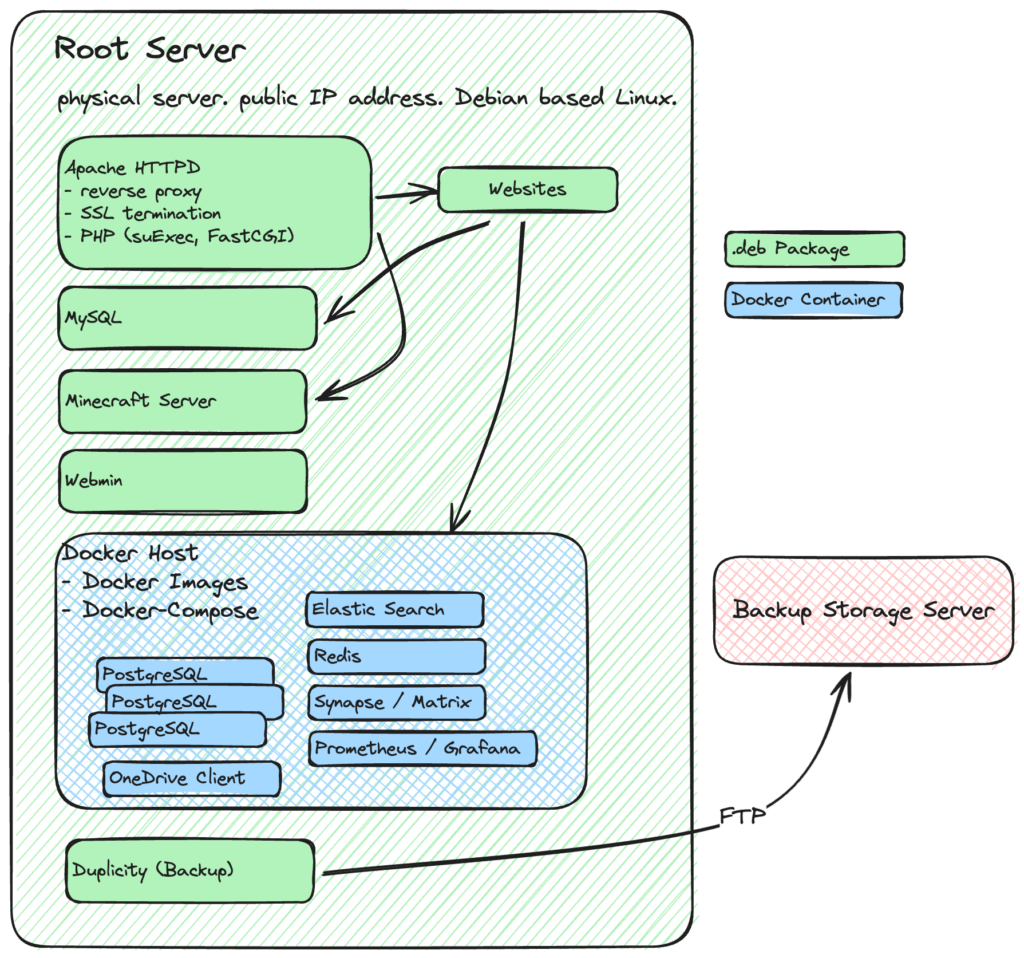
My «Lab» mainly consists of a Hetzner Root Server. I used Munin for a very long time to look at some metrics and whats going on. Still a very easy and useful solution. But I wanted to poke around in things… and the amount of things keeps stacking up and finding a Munin plugin turned difficult.
Over time some rather sophisticated setups have emerged. There is SSL termination. Some tools are now running will as Docker Container. Some absolutely not. There is a mixture of directly installed packages and services that are docker based. And I want to monitor all of them.
And then there is the endless story of alerting.
It was time for something else. Be it to play around with stuff only 🙂
I’ve worked with Grafana a bit and was quite happy with it. So I tried to get it working.
Goals:
- monitor services installed directly on the server
- monitor some of the docker services
- monitor backup space
- have fancy dashboards to start with
- run it as docker-compose swarm of things – so it’s easy to be tossed away in case I get angry
Lucky me there are docker-compose instructions for grafana in the docs. And a lot of examples that describe Prometheus and Grafana, like the ones at awesome-compose/prometheus-grafana.
I created a «prometheus» user and group on the server (using webmin, yes I’m that kind of person).
The docker-compose file
I put the docker-compose.yaml in /home/prometheus
version: '3.8'
services:
  apache-exporter:
    image: bitnami/apache-exporter:latest
    extra_hosts:
      - "host.docker.internal:host-gateway"
    container_name: apache-exporter
    restart: unless-stopped
    networks:
      - monitoring
    command:
      - '--scrape_uri=http://host.docker.internal/server-status/?auto'

  elastic-exporter:
    image: prometheuscommunity/elasticsearch-exporter:v1.6.0
    extra_hosts:
      - "host.docker.internal:host-gateway"
    container_name: elastic-exporter
    restart: unless-stopped
    networks:
      - monitoring
    command:
      - '--es.uri=http://host.docker.internal:9716'
      - '--es.indices'

  redis-exporter:
    image: oliver006/redis_exporter:v1.55.0
    extra_hosts:
      - "host.docker.internal:host-gateway"
    container_name: redis-exporter
    restart: unless-stopped
    networks:
      - monitoring
    environment:
      - REDIS_ADDR=host.docker.internal:6379

  mysqld-exporter:
    image: prom/mysqld-exporter:v0.15.0
    extra_hosts:
      - "host.docker.internal:host-gateway"
    container_name: mysqld-exporter
    restart: unless-stopped
    command:
     - '--collect.info_schema.tables'
     - '--collect.info_schema.tables.databases=schemaname'
     - '--collect.perf_schema.indexiowaits'
     - '--collect.perf_schema.tableiowaits'
     - '--collect.perf_schema.tablelocks'
     - '--collect.perf_schema.eventsstatements'
     - "--mysqld.username=user:password"
     - "--mysqld.address=host.docker.internal:3306"
    networks:
      - monitoring

  cadvisor:
    image: gcr.io/cadvisor/cadvisor:v0.47.2
    container_name: cadvisor
    restart: unless-stopped
    volumes:
      - /:/rootfs:ro
      - /var/run:/var/run:rw
      - /sys:/sys:ro
      - /var/lib/docker/:/var/lib/docker:ro
    networks:
      - monitoring

  node-exporter:
    image: prom/node-exporter:latest
    container_name: node-exporter
    restart: unless-stopped
    volumes:
      - /proc:/host/proc:ro
      - /sys:/host/sys:ro
      - /:/rootfs:ro
      - /usr/share/prometheus/node-exporter/:/host-files:ro
    command:
      - '--path.procfs=/host/proc'
      - '--path.rootfs=/rootfs'
      - '--path.sysfs=/host/sys'
      - '--collector.filesystem.mount-points-exclude=^/(sys|proc|dev|host|etc)($$|/)'
      - '--collector.textfile.directory=/host-files'
    networks:
      - monitoring

  prometheus:
    image: prom/prometheus:v2.48.1
    extra_hosts:
      - "host.docker.internal:host-gateway"
    container_name: prometheus
    restart: unless-stopped
    volumes:
      - ./conf/prometheus.yml:/etc/prometheus/prometheus.yml:ro
      - prometheus_data:/prometheus
    command:
      - '--config.file=/etc/prometheus/prometheus.yml'
      - '--storage.tsdb.path=/prometheus'
      - '--web.console.libraries=/etc/prometheus/console_libraries'
      - '--web.console.templates=/etc/prometheus/consoles'
      - '--web.enable-lifecycle'
      - '--storage.tsdb.retention.time=365d'
      - '--storage.tsdb.retention.size=200GB'
    networks:
      - monitoring
    depends_on:
      - cadvisor
      - node-exporter
      - mysqld-exporter
      - redis-exporter

  grafana:
    image: grafana/grafana-oss:10.2.2
    container_name: grafana
    restart: unless-stopped
    environment:
     - GF_SERVER_DOMAIN=grafana.brontofundus.ch
    networks:
      - monitoring
    volumes:
      - grafana_data:/var/lib/grafana
    ports:
      - 9099:3000
    depends_on:
      - prometheus

networks:
  monitoring:
    driver: bridge

volumes:
  prometheus_data:
  grafana_data:
WHAT IS ALL THIS?!? Nothing to be afraid of! One by one:
services:
  apache-exporter:
    image: bitnami/apache-exporter:latest
    command:
      - '--scrape_uri=http://host.docker.internal/server-status/?auto'

  elastic-exporter:
    image: prometheuscommunity/elasticsearch-exporter:v1.6.0

  redis-exporter:
    image: oliver006/redis_exporter:v1.55.0
    extra_hosts:
      - "host.docker.internal:host-gateway"
    environment:
      - REDIS_ADDR=host.docker.internal:6379

  mysqld-exporter:
    image: prom/mysqld-exporter:v0.15.0

  cadvisor:
    image: gcr.io/cadvisor/cadvisor:v0.47.2

  node-exporter:
    image: prom/node-exporter:latest

  prometheus:
    image: prom/prometheus:v2.48.1

  grafana:
    image: grafana/grafana-oss:10.2.2
    environment:
     - GF_SERVER_DOMAIN=grafana.brontofundus.ch
Important details
apache-exporter
the apache-exporter connects from the docker-container to the physical server (as apache runs directly on that machine).
To be able to do that without detecting the docker host IP address you can pass the docker-host as name into the docker-container:
    extra_hosts:
      - "host.docker.internal:host-gateway"
So whenever there is a configuration like «host.docker.internal:9716» the container from the compose-file above connects to the post 9716 on the physical machine – whether that service runs directly installed or as another docker-container is not important.
This exporter requires the status module in apache httpd to be activated:
# a2enmod statusAlso make sure that it can be accessed from the docker-container by checking the Require ip Statement or the Apache logs:
nano /etc/apache2/mods-enabled/status.conf

<IfModule mod_status.c>
        <Location /server-status>
                SetHandler server-status
                Require local
                Require ip 192.168.0.0/16
        </Location>

        ExtendedStatus On

        <IfModule mod_proxy.c>
                ProxyStatus On
        </IfModule>
</IfModule>
elastic-exporter
One of the available exporters to collect the Elastic Search monitoring data. I run elastic search also via docker-compose. Nothing to special here. But be aware of the host.docker.internal config as this exporter needs to «turn» in the physical server to connect back into docker. I don’t want to maintain a list of networks in docker. I only keep a list of ports that run services. Its enough for me.
redis-exporter
Pretty much the same as the elastic-exporter. I run redis also as docker container from a different compose file.
mysqld-exporter
More of the same. This exporter also needs to connect to a port on the physical machine. But this time mysqld is installed via apt using the .deb package. But that does not matter for the exporter. You should create a dedicated user as stated in the readme of the docker image. Note to not use the environment variable «DATA_SOURCE_NAME» as stated on docker hub. That is currently broken, use the command params as above.
cadvisor
Exports docker-host statistics to prometheus. Therefore all important docker files are mounted for this one.
node-exporter
Exports generic metrics of the physical server into prometheus.
prometheus
At last the backend that stores all the data and that is used by Grafana to query the data. The configuration allows to limit the size of the storage. Depending on the activity on the server this needs to be adjusted to your needs.
grafana
This serves the Grafana UI to be used.
The Apache HTTPd contains a virtual host configuration to connect to this container. Below the essentials of the config I use (Log Files and stuff omitted to keep it short)
<VirtualHost *:443>
	SSLEngine on
	ServerName grafana.brontofundus.ch

	ProxyPreserveHost on
	ProxyPass / http://127.0.0.1:9099/ nocanon
	ProxyPassReverse / http://127.0.0.1:9099/

        Include /etc/letsencrypt/options-ssl-apache.conf
        SSLCertificateFile /etc/letsencrypt/somewhere/fullchain.pem
        SSLCertificateKeyFile /etc/letsencrypt/somewhere/privkey.pem
</VirtualHost>
The domain points to the physical servers IP address and this virtual host then proxies the requests to grafana.
Prometheus configuration
If you paid attention, you will have noticed the «conf/promethus.yml» directory for prometheus above.
There is some additional magic configured in here. Mainly which exporters prometheus will go through to collect its data.
prometheus.yml
global:
  scrape_interval: 15s

scrape_configs:
- job_name: "synapse"
  metrics_path: "/_synapse/metrics"
  static_configs:
  - targets:
    - "host.docker.internal:28088"
- job_name: "redis-exporter"
  static_configs:
  - targets:
    - "redis-exporter:9121"
- job_name: "mysqld"
  static_configs:
  - targets:
    - "mysqld-exporter:9104"
- job_name: "cadvisor"
  static_configs:
  - targets:
    - "cadvisor:8080"
- job_name: "node-exporter"
  static_configs:
    - targets:
      - "node-exporter:9100"
- job_name: "elastic-exporter"
  static_configs:
    - targets:
      - "elastic-exporter:9114"
- job_name: "apache-exporter"
  static_configs:
    - targets:
      - "apache-exporter:9117"
- job_name: "minecraft"
  static_configs:
    - targets:
      - "host.docker.internal:57893"
      labels:
        server_name: "milooos-thevulcan"
- job_name: "wireguard"
  static_configs:
    - targets:
      - "host.docker.internal:9586"
Synapse (the matrix.org chat server) allows to directly monitor its metrics. So no exporter is required. You may need to enable the metrics in Synapse depending on your version.
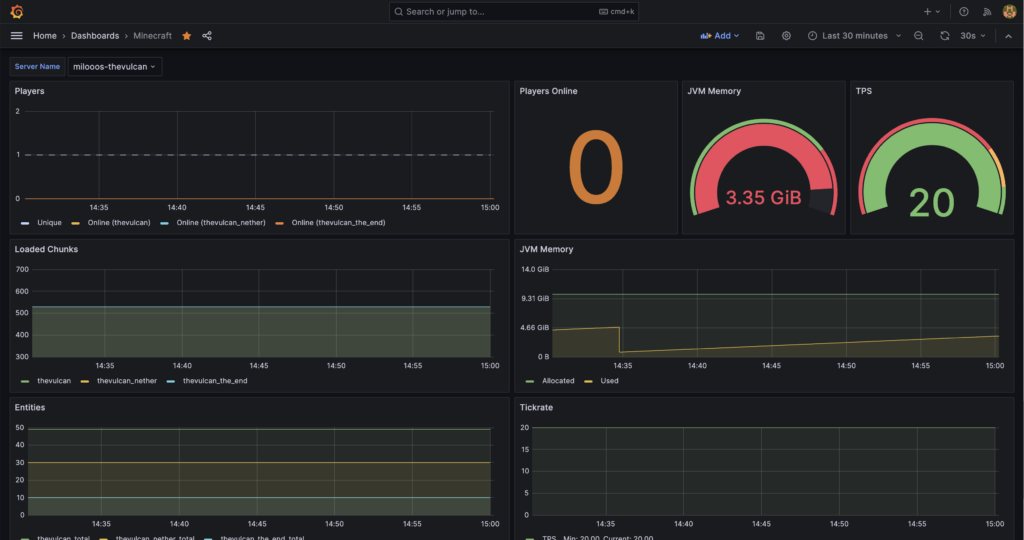
The minecraft server runs PaperMC and the minecraft-prometheus-exporter to enable metrics. Not Grafana / Prometheus related: I also use MSCS to maintain the servers and different worlds as well as startup / shutdown and backups.
Monitoring the Backup space on the FTP Backup server
If you look into the docker-compose.yml file in the node-exporter service you will notice the node-exporter directory that is mounted into host-files:
  node-exporter:
    image: prom/node-exporter:latest
    volumes:
      - /usr/share/prometheus/node-exporter/:/host-files:ro
    command:
      - '--collector.textfile.directory=/host-files'
This is a way to write statistics into a file, and have its content picked-up by prometheus via the node-exporter.
Since there is no REST API for the backup server that I’m aware of, I use a workaround:
I use lftp and moreutils (installed via apt) to put the used space into a file run via cron:
# in /etc/crontab
# export Backup Space for Prometheus:
38 8   * * * root /usr/local/bin/cron_ftp_size.sh
And the cron_ftp_size.sh script:
#!/bin/bash
#
ftpsize=`echo "du -sb" | lftp -u usernameid,userpassword username.your-storagebox.de | awk '{print $1}'`

echo "# HELP backup_ftp_size Size in Bytes used on the FTP backup storagebox.
# TYPE backup_ftp_size gauge
backup_ftp_size ${ftpsize}" | sponge > /usr/share/prometheus/node-exporter/backup_ftp_size.prom
Details on the format can be found at: prometheus.io exposition_formats.
The contents of /usr/share/prometheus/node-exporter/backup_ftp_size.prom should then look like:
# HELP backup_ftp_size Size in Bytes used on the FTP backup storagebox.
# TYPE backup_ftp_size gauge
backup_ftp_size 35515140139
This file (or the directory it is in) is then pulled for updates by the node exporter. Its a bit weird – I have to admit – but it works quite well. How does that look like?!
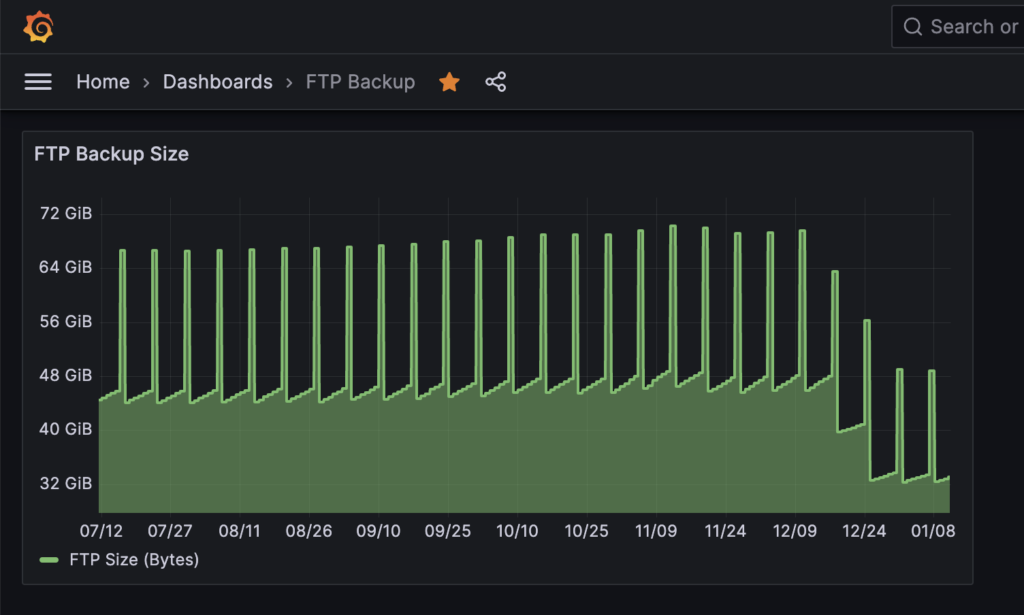
This shows the used backup space. I use ftplicity / duplicity for backups.
The peaks are the second full-backup that is then cleaned up. The small increments are the incremental backups. The drop at the end is based on a deleted service (and therefore saving space).
Dashboards
There are a lot of ready to rumble dashboards available at Grafana Dashboards. Usually every available exporter has a default dashboard to get started with.
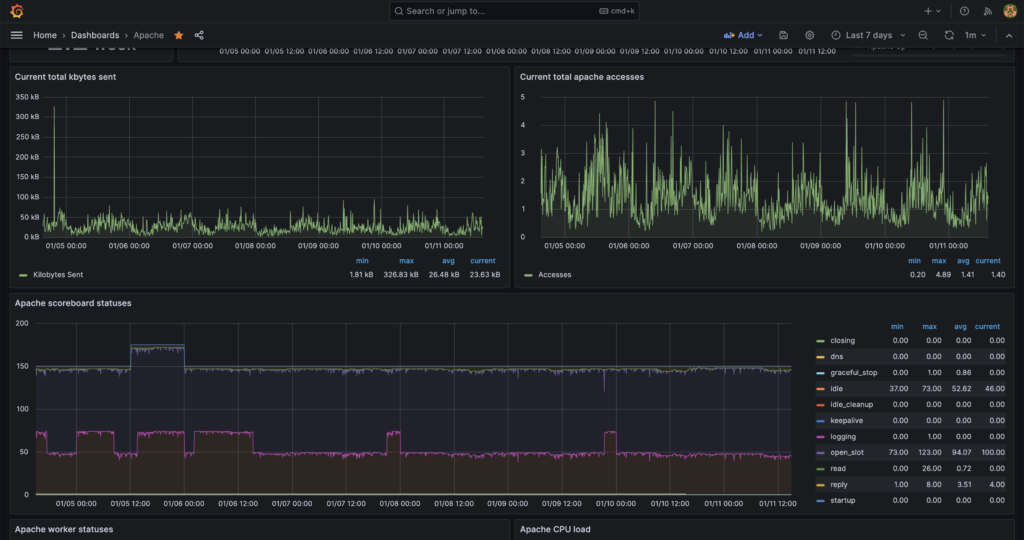
Apache:
Minecraft:
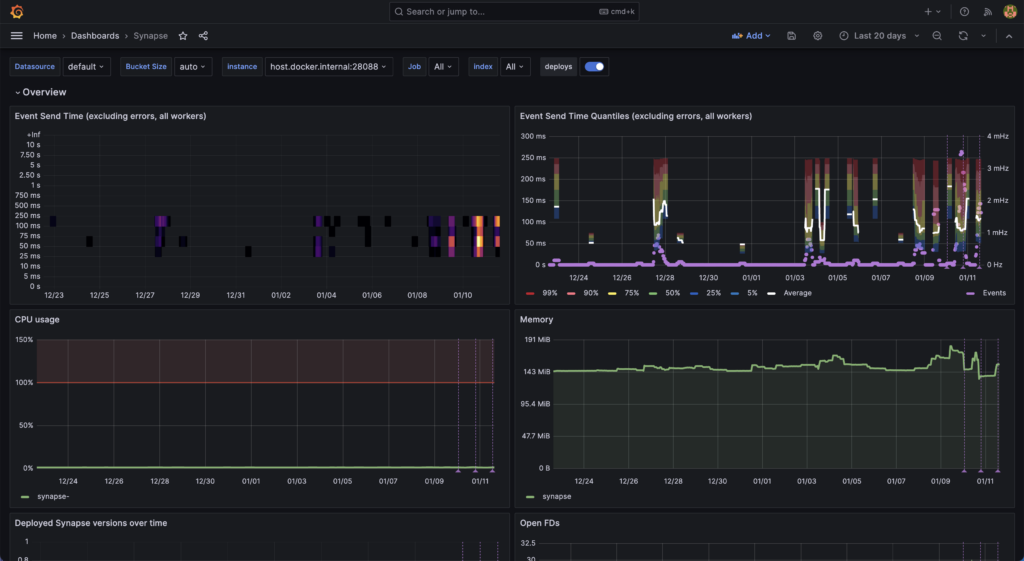
Synapse / Matrix Chat:
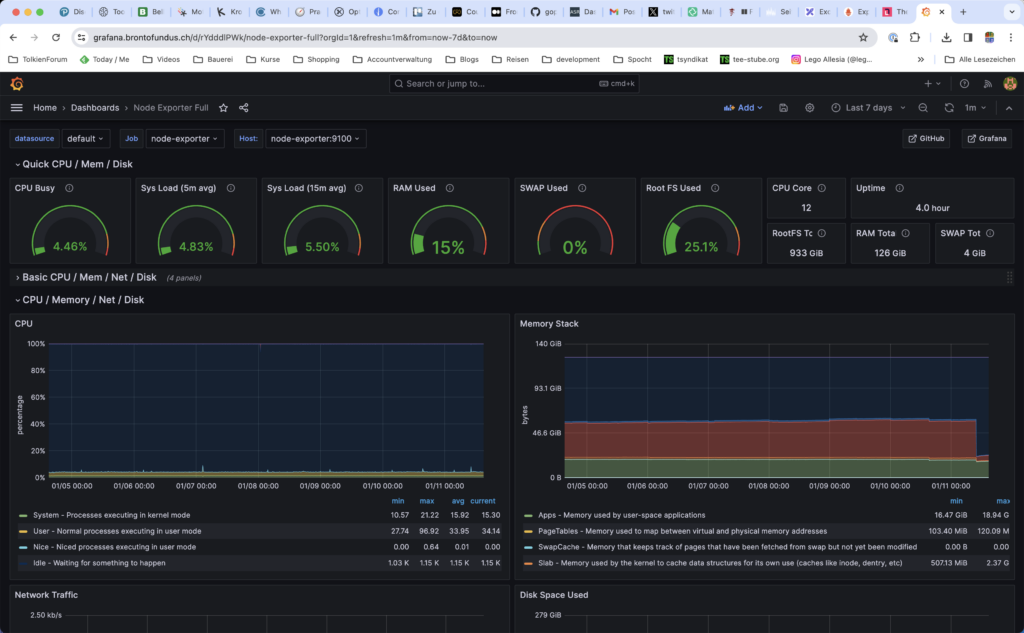
Node-Exporter (physical server):
The strangeness that is wireguard:
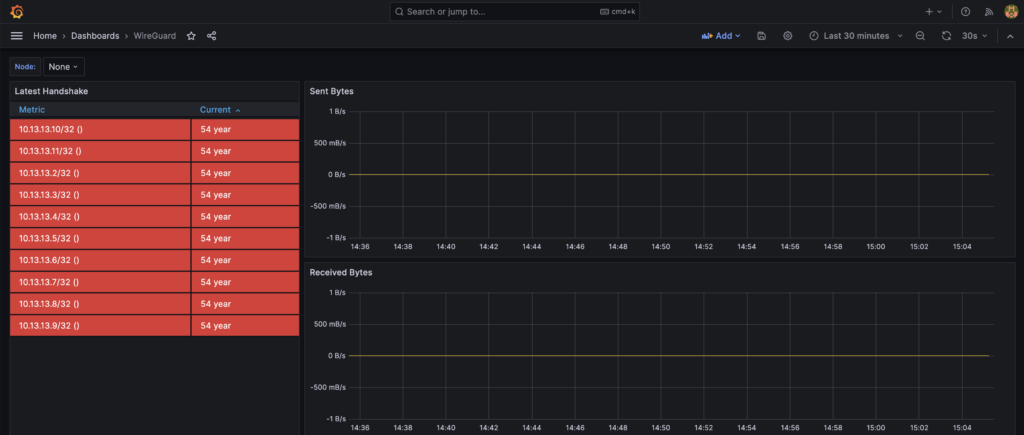
I haven’t been able to find a somewhat humane dashboard (like on that shows the currently connected users). But it somewhat works.
In summary this is quite nice! I’m gonna keep this running and will try to get into alerts.
Compared to my previous munin setup: it’s a nightmare…